Projects
This page contains a brief overview of projects that I significantly shaped throughout the entire project life cycle. In academic terms, this mostly corresponds to first-author publications (single and shared). If you’re interested in a full list of projects I have been involved in, please check out my CV.
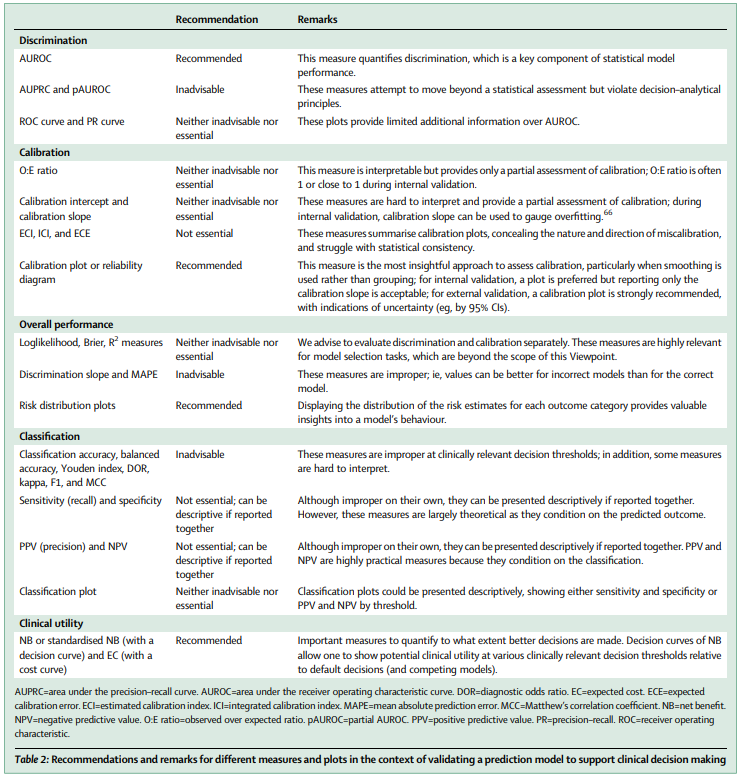
Evaluation of performance measures in predictive artificial intelligence models to support medical decisions: overview and guidance
Summary: Numerous measures have been proposed to illustrate the performance of predictive artificial intelligence (AI) models. Selecting appropriate performance measures is essential for predictive AI models intended for use in medical practice. Poorly performing models are misleading and may lead to wrong clinical decisions that can be detrimental to patients and increase financial costs. In this Viewpoint, we assess the merits of classic and contemporary performance measures when validating predictive AI models for medical practice, focusing on models that estimate probabilities for a binary outcome. We discuss 32 performance measures covering five performance domains (discrimination, calibration, overall performance, classification, and clinical utility) along with corresponding graphical assessments. The first four domains address statistical performance, whereas the fifth domain covers decision–analytical performance. We discuss two key characteristics when selecting a performance measure and explain why these characteristics are important: (1) whether the measure’s expected value is optimised when calculated using the correct probabilities (ie, whether it is a proper measure) and (2) whether the measure solely reflects statistical performance or decision–analytical performance by properly accounting for misclassification costs. 17 measures showed both characteristics, 14 showed one, and one (F1 score) showed neither. All classification measures were improper for clinically relevant decision thresholds other than when the threshold was 0·5 or equal to the true prevalence. We illustrate these measures and characteristics using the ADNEX model which predicts the probability of malignancy in women with an ovarian tumour. We recommend the following measures and plots as essential to report: area under the receiver operating characteristic curve, calibration plot, a clinical utility measure such as net benefit with decision curve analysis, and a plot showing probability distributions by outcome category.
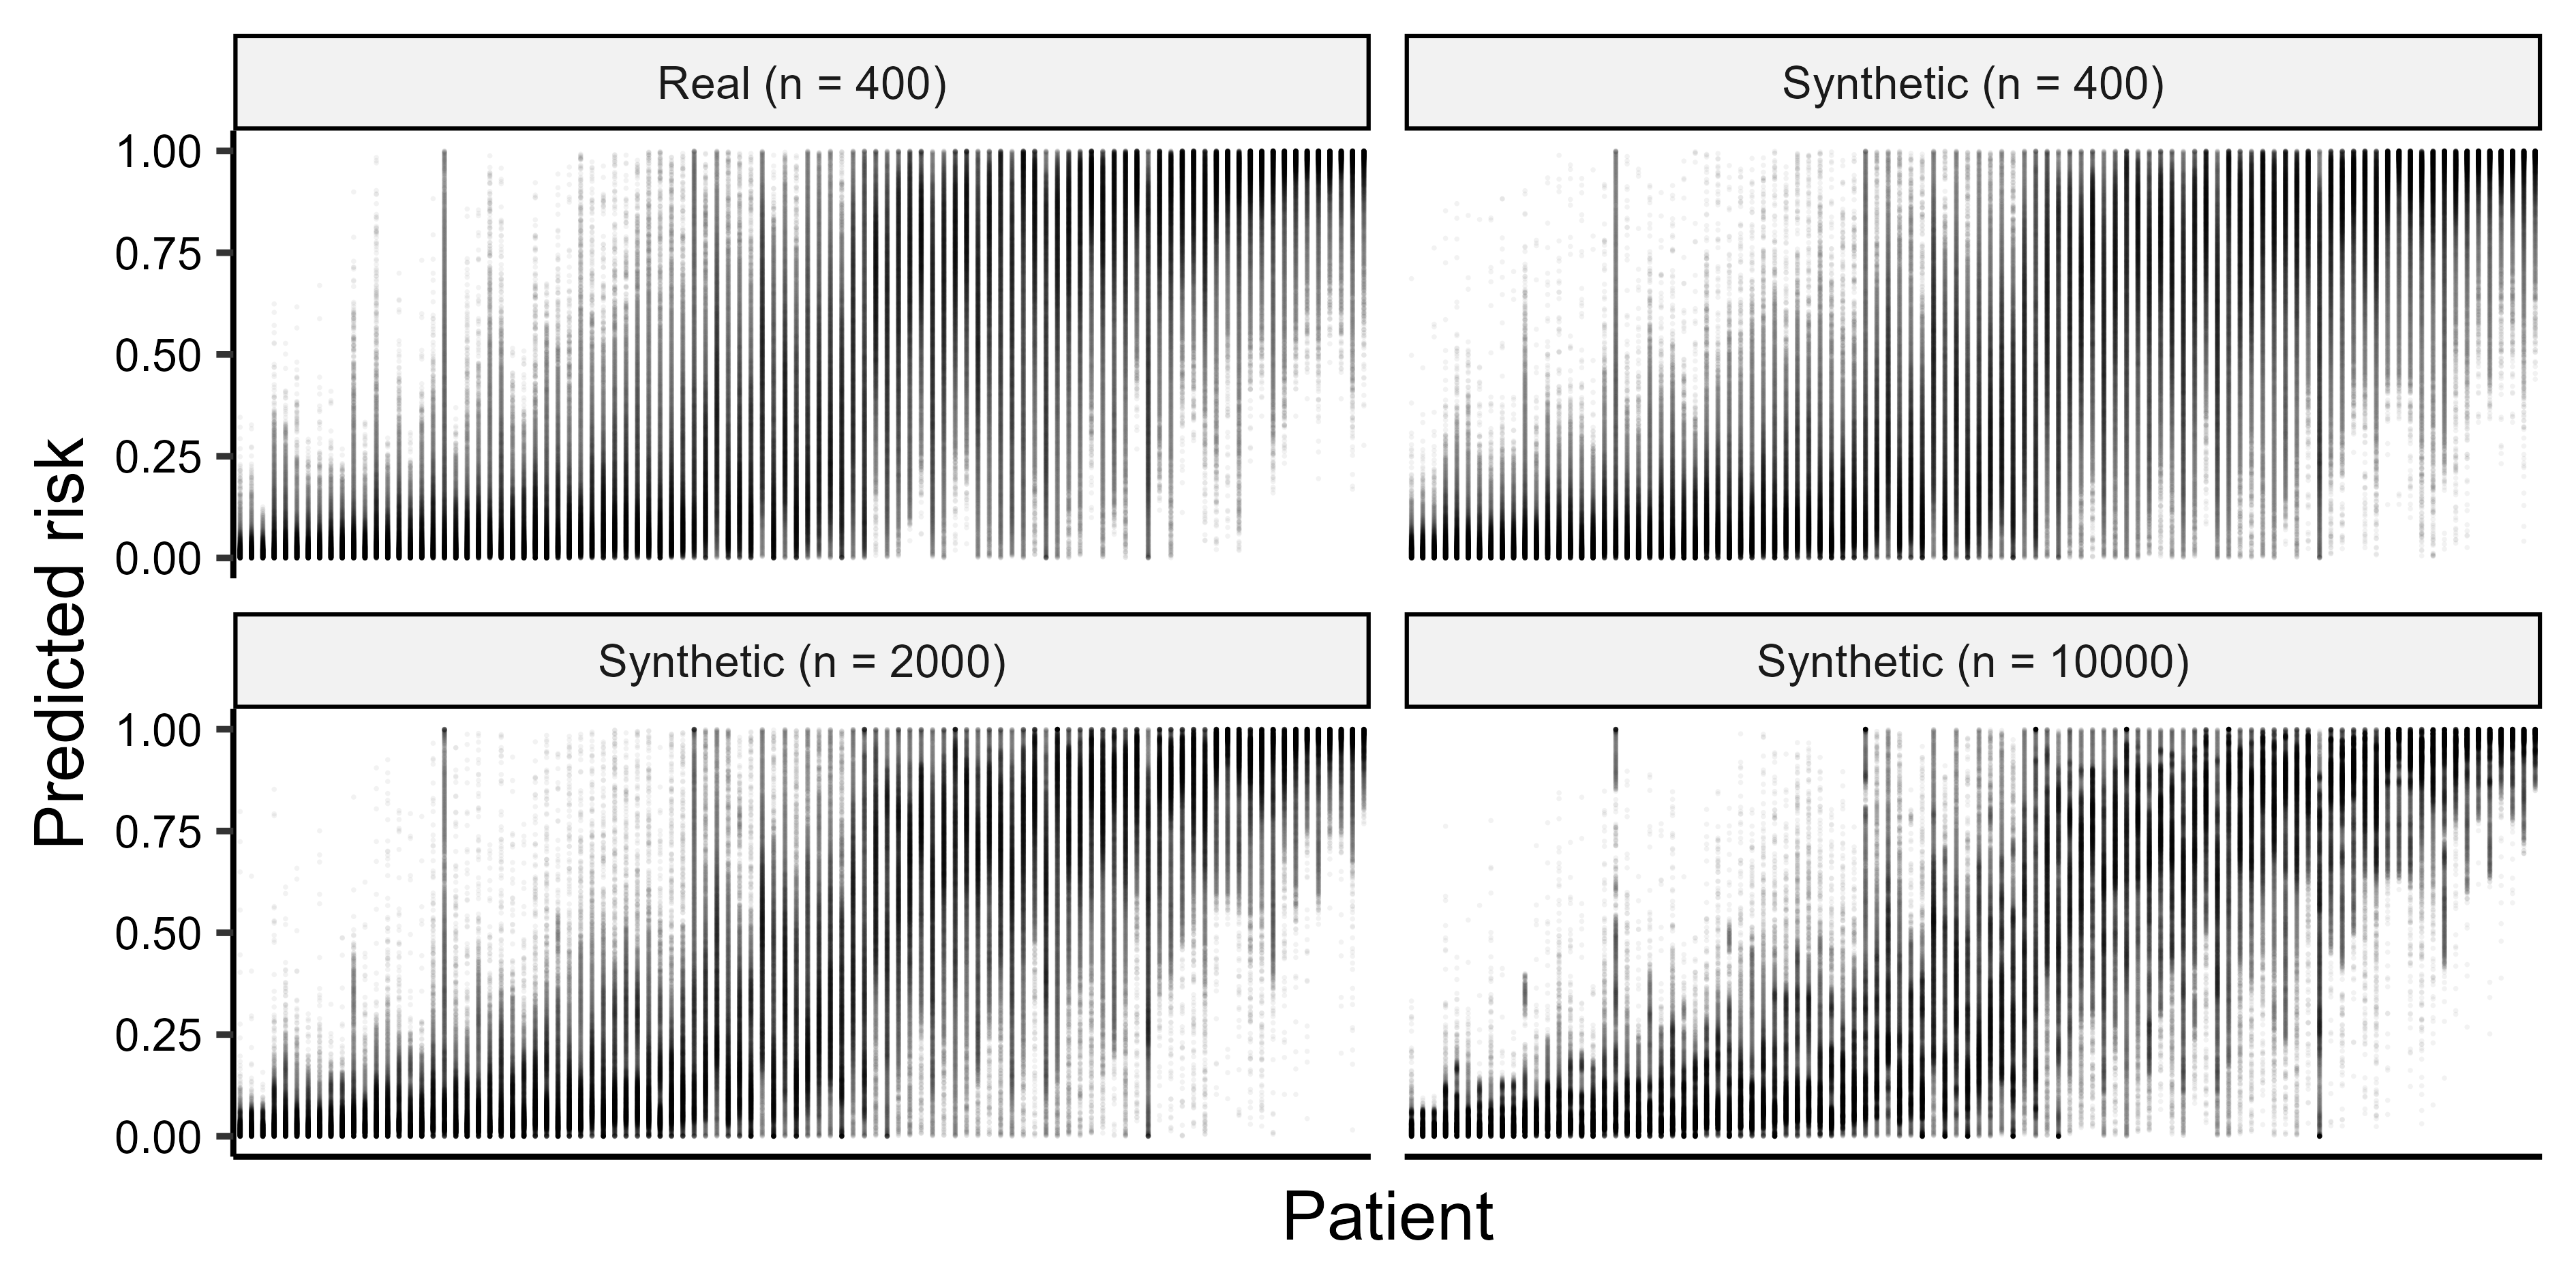
The fundamental problem of risk prediction for individuals: health AI, uncertainty, and personalized medicine
Abstract: Clinical prediction models for a health condition are commonly evaluated regarding performance for a population, although decisions are made for individuals. The classic view relates uncertainty in risk estimates for individuals to sample size (estimation uncertainty) but uncertainty can also be caused by model uncertainty (variability in modeling choices) and applicability uncertainty (variability in measurement procedures and between populations). Methods: We used real and synthetic data for ovarian cancer diagnosis to train 59400 models with variations in estimation, model, and applicability uncertainty. We then used these models to estimate the probability of ovarian cancer in a fixed test set of 100 patients and evaluate the variability in individual estimates. Findings: We show empirically that estimation uncertainty can be strongly dominated by model uncertainty and applicability uncertainty, even for models that perform well at the population level. Estimation uncertainty decreased considerably with increasing training sample size, whereas model and applicability uncertainty remained large. Interpretation: Individual risk estimates are far more uncertain than often assumed. Model uncertainty and applicability uncertainty usually remain invisible when prediction models or algorithms are based on a single study. Predictive algorithms should inform, not dictate, care and support personalization through clinician-patient interaction rather than through inherently uncertain model outputs. Funding: This research is supported by Research Foundation Flanders (FWO) grants G097322N, G049312N, G0B4716N, and 12F3114N to BVC and/or DTi, KU Leuven internal grants C24M/20/064 and C24/15/037 to BVC and/or DT, ZoNMW VIDI grant 09150172310023 to LW. DT is a senior clinical investigator of FWO.
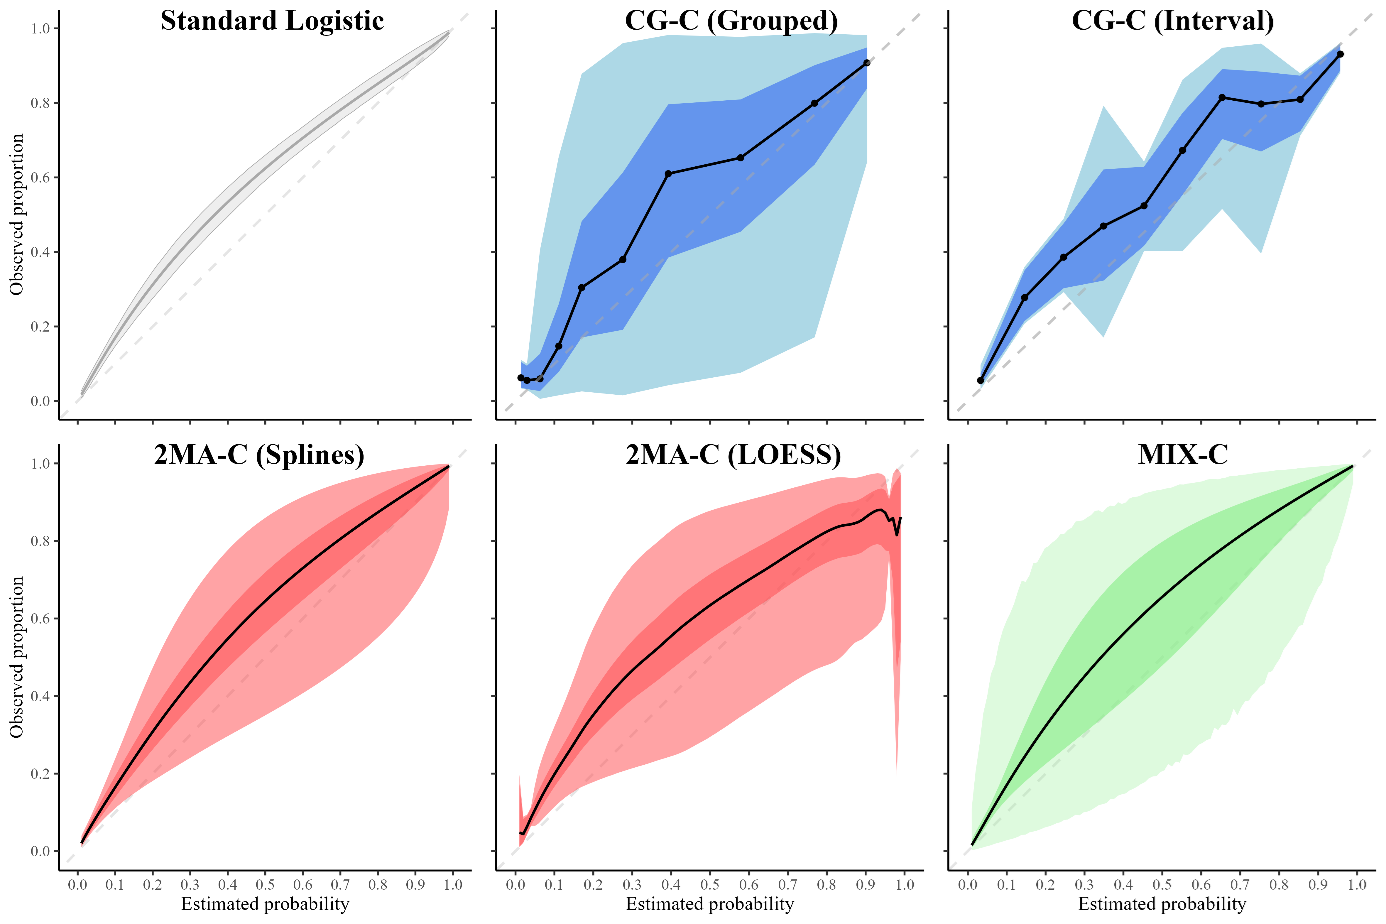
Clustered flexible calibration plots for binary outcomes using random effects modeling
Abstract: Evaluation of clinical prediction models across multiple clusters, whether centers or datasets, is becoming increasingly common. A comprehensive evaluation includes an assessment of the agreement between the estimated risks and the observed outcomes, also known as calibration. Calibration is of utmost importance for clinical decision making with prediction models and it may vary between clusters. We present three approaches to take clustering into account when evaluating calibration. (1) Clustered group calibration (CG-C), (2) two-stage meta-analysis calibration (2MA-C) and (3) mixed model calibration (MIX-C) can obtain flexible calibration plots with random effects modelling and providing confidence and prediction intervals. As a case example, we externally validate a model to estimate the risk that an ovarian tumor is malignant in multiple centers (N = 2489). We also conduct a simulation study and synthetic data study generated from a true clustered dataset to evaluate the methods. In the simulation study MIX-C and 2MA-C (splines) gave estimated curves closest to the true overall curve. In the synthetic data study MIX-C produced cluster specific curves closest to the truth. Coverage of the prediction interval across the plot was best for 2MA-C with splines. We recommend using 2MA-C with splines to estimate the overall curve and the 95% PI and MIX-C for the cluster specific curves, especially when sample size per cluster is limited. We provide ready-to-use code to construct summary flexible calibration curves with confidence and prediction intervals to assess heterogeneity in calibration across datasets or centers.
Head-to-head comparison of the RMI and ADNEX models to estimate the risk of ovarian malignancy: systematic review and meta-analysis of external validation studies
Background: ADNEX and RMI are models to estimate the risk of malignancy of ovarian masses based on clinical and ultrasound information. The aim of this systematic review and meta-analysis is to synthesise head to-head comparisons of these models.
Methods: We performed a systematic literature search up to 31/07/2024. We included all external validation studies of the performance of ADNEX and RMI on the same data. We did a random effects meta-analysis of the area under the receiver operating characteristic curve (AUC), sensitivity, specificity, net benefit and relative utility at 10% malignancy risk threshold for ADNEX and 200 cutoff for RMI.
Results: We included 11 studies comprising 8271 tumours. Most studies were at high risk of bias (incomplete reporting, poor methodology). For ADNEX with CA125 vs RMI, the summary AUC to distinguish benign from malignant tumours in operated patients was 0.92 (CI 0.90-0.94) for ADNEX and 0.85 (CI 0.80-0.89) for RMI. Sensitivity and specificity for ADNEX were 0.93 (0.90-0.96) and 0.77 (0.71-0.81). For RMI they were 0.61 (0.56-0.67) and 0.93 (0.90-0.95). The probability of ADNEX being clinically useful in operated patients was 96% vs 15% for RMI at the selected cutoffs (10%, 200).
Conclusion: ADNEX is clinically more useful than RMI.
Understanding random forests and overfitting: a visualization and simulation study
Random forests have become popular for clinical risk prediction modelling. In a case study on predicting ovarian malignancy, we observed training c-statistics close to 1. Although this suggests overfitting, performance was competitive on test data. We aimed to understand the behaviour of random forests by (1) visualizing data space in three real world case studies and (2) a simulation study. For the case studies, risk estimates were visualised using heatmaps in a 2-dimensional subspace. The simulation study included 48 logistic data generating mechanisms (DGM), varying the predictor distribution, the number of predictors, the correlation between predictors, the true c-statistic and the strength of true predictors. For each DGM, 1000 training datasets of size 200 or 4000 were simulated and RF models trained with minimum node size 2 or 20 using ranger package, resulting in 192 scenarios in total. The visualizations suggested that the model learned spikes of probability around events in the training set. A cluster of events created a bigger peak, isolated events local peaks. In the simulation study, median training c-statistics were between 0.97 and 1 unless there were 4 or 16 binary predictors with minimum node size 20. Median test c-statistics were higher with higher events per variable, higher minimum node size, and binary predictors. Median training slopes were always above 1, and were not correlated with median test slopes across scenarios (correlation -0.11). Median test slopes were higher with higher true c-statistic, higher minimum node size, and higher sample size. Random forests learn local probability peaks that often yield near perfect training c-statistics without strongly affecting c-statistics on test data. When the aim is probability estimation, the simulation results go against the common recommendation to use fully grown trees in random forest models.
ADNEX risk prediction model for diagnosis of ovarian cancer: systematic review and meta-analysis of external validation studies
Objectives: To conduct a systematic review of studies externally validating the ADNEX (Assessment of Different Neoplasias in the adnexa) model for diagnosis of ovarian cancer and to present a meta-analysis of its performance.
Design: Systematic review and meta-analysis of external validation studies
Data sources: Medline, Embase, Web of Science, Scopus, and Europe PMC, from 15 October 2014 to 15 May 2023.
Eligibility criteria for selecting studies: All external validation studies of the performance of ADNEX, with any study design and any study population of patients with an adnexal mass. Two independent reviewers extracted the data. Disagreements were resolved by discussion. Reporting quality of the studies was scored with the TRIPOD (Transparent Reporting of a multivariable prediction model for Individual Prognosis Or Diagnosis) reporting guideline, and methodological conduct and risk of bias with PROBAST (Prediction model Risk Of Bias Assessment Tool). Random effects meta-analysis of the area under the receiver operating characteristic curve (AUC), sensitivity and specificity at the 10% risk of malignancy threshold, and net benefit and relative utility at the 10% risk of malignancy threshold were performed.
Results: 47 studies (17007 tumours) were included, with a median study sample size of 261 (range 24-4905). On average, 61% of TRIPOD items were reported. Handling of missing data, justification of sample size, and model calibration were rarely described. 91% of validations were at high risk of bias, mainly because of the unexplained exclusion of incomplete cases, small sample size, or no assessment of calibration. The summary AUC to distinguish benign from malignant tumours in patients who underwent surgery was 0.93 (95% confidence interval 0.92 to 0.94, 95% prediction interval 0.85 to 0.98) for ADNEX with the serum biomarker, cancer antigen 125 (CA125), as a predictor (9202 tumours, 43 centres, 18 countries, and 21 studies) and 0.93 (95% confidence interval 0.91 to 0.94, 95% prediction interval 0.85 to 0.98) for ADNEX without CA125 (6309 tumours, 31 centres, 13 countries, and 12 studies). The estimated probability that the model has use clinically in a new centre was 95% (with CA125) and 91% (without CA125). When restricting analysis to studies with a low risk of bias, summary AUC values were 0.93 (with CA125) and 0.91 (without CA125), and estimated probabilities that the model has use clinically were 89% (with CA125) and 87% (without CA125).
Conclusions: The results of the meta-analysis indicated that ADNEX performed well in distinguishing between benign and malignant tumours in populations from different countries and settings, regardless of whether the serum biomarker, CA125, was used as a predictor. A key limitation was that calibration was rarely assessed.
Systematic review registration: PROSPERO CRD42022373182.


